How to Create, Analyze and Master Income Statements
The income statement provides information about the profit and loss over the length of time.
FINANCE
Dezmon
11/27/20255 min read


The income statement provides information about the loss and profit of a company over a certain period of time, usually on a quarterly, semi-annual or annual basis. With this statement, an organization will be able to see the summary of its total earnings and all of its expenses.
This statement can be considered as the simplest among the statements used in corporate finance and accounting. For this reason, companies often use this place as the starting point for their financial planning process. For entrepreneurs, especially solopreneurs, the income statement helps outline their business performances, which can be used to make analysis and create plans accordingly.
In order to create an income statement, understanding its fundamentals is necessary. Although the components in the income statement can vary from enterprise to enterprise due to the different nature of businesses, there are some core components that can be found in all income statements, as explained below:


Income Statement Core Components
Revenue: Revenue is the company’ income generated from its sales or services. This item is commonly shown at the very top of the statement table. It is possible to see an aggregation of revenue from different lines of product/service here instead if the company has multiple streams of income.
Cost of Goods Sold (COGS): This is the cost directly related to each product that is sold, such as raw materials costs, labor costs, storage costs, etc.
Gross Profit: The remaining revenue after subtracting the cost of goods sold from sales revenue.
Marketing Expenses: Expenses associated with marketing, advertising, and promotion fall upon this category. It is also the cost of selling products or services in which most companies invest to stimulate sales. Sometimes this is reported together with the G&A expenses as SG&A (Sales, General and Administrative) expenses.
General and Administrative (G&A) Expenses: Consist of a company's expenses that aren’t directly related to the costs of production or cost of goods sold. Examples include salaries and wages, rent and office expenses, insurance, travel expenses, and other operational expenses. Sometimes this is reported together with the marketing expenses as SG&A (Sales, General and Administrative) expenses.
Earnings before Interest, Tax, Depreciation and Amortization (EBITDA): The remaining earnings after subtracting the G&A and Marketing expenses from gross profit. These earnings reflect the profit a company makes at the operation level, without considering the non-monetary expenses like depreciation and amortization.
Depreciation & Amortization Expense: These types of expenses are used to capture the costs of assets that don't incur directly, but should be considered.
For example, Company A owns a machine with a lifetime value of $10M which is expected to be replaced in 10 years. Other than the maintenance costs, which are already included in SG&A, the machine itself doesn’t incur any obvious costs.
As a result, accountants came up with a way to reflect the cost of this machine, a tangible asset, by spreading out the machine costs over its lifetime value, meaning that the machine will incur $1M in Depreciation expenses each year, up until the 10th year where its value is fully depleted.
The same method can be applied to intangible assets, like software licenses and patents, but the expenses caused will be referred to as Amortization expenses instead.
Earnings Before Interest and Taxes (EBIT): Also known as the Operating Profit, is simply the remaining income from EBITDA, after being subtracted by Depreciation & Amortization expenses. This level of earnings is normally observed in order to measure the income a company can generate, without taking into account the tax-related and financial burden items.
Interest Expense: Sometimes shown as Finance Costs, these are the expenses that incurred from the company’s financial liabilities. It can be used to measure the financial situation and strength of a company.
Other Expenses: As some expenses are company-specific, the spendings incurred can vary. Special expenses that aren’t directly related to the operations and can’t be captured by any other type of the previously mentioned expenses will be recorded here. These costs may involve technology, research and development, stock-based compensation, impairment charges, gains/losses on the sale of investments, foreign exchange impacts, and etc.
Earnings Before Tax (EBT): As its name suggests, this is the earnings that include all but the tax expenses of the company. It is also known as the Pre-tax Income.
Income Taxes: This is all the relevant income taxes that are charged to the company. Income tax expenses can include both current and future taxes.
Net Income: This is the total profit a company will receive, net from all of the expenses incurred in a fiscal period. It is calculated by subtracting income taxes from pre-tax income. After being deducted by dividends, the remaining amount will be kept in the balance sheets as Retained Earnings.
Income Statement Analysis
When it comes to analysis, there are multiple ways to analyze an income statement based on the objective of the analyst. However, we will introduce to you 2 of the common methods: vertical analysis and horizontal analysis.
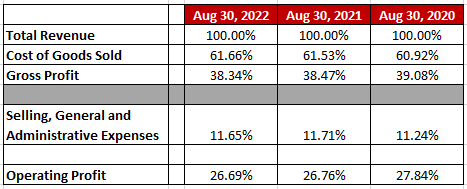
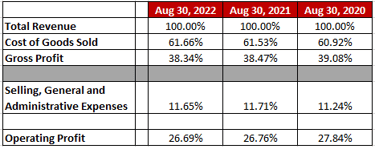
1. Vertical Analysis: As the name indicates, vertical analysis requires analysts to look up and down through the income statement. Each line item will be listed as a percentage of a base figure, usually the total revenue. Therefore, the items in the statement are displayed as percentages of the said figure, not in the exact amounts of money.


As relative proportions of individual items are shown, vertical analysis allows for the comparison between eachitem’s proportion on the statement, different statements over periods of time, or statements between organizations. This way, analysts will be able to address the issues such as cost-revenue proportion, cost control ability, etc.
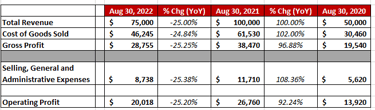
2. Horizontal Analysis: In contrast to vertical analysis, the horizontal method will instead look through each item of the income statement in the amounts of money, often on a year-over-year (YoY) basis. This allows them to see and compare the rate of change for each item, reflecting its trend on the corresponding timeframe.
Horizontal analysis allows for the review of a company’s growth trend and consistency, which can be used to compare with its own historical values or its competitors’. This is extremely important to both investors and analysts as it can represent the financial performance over the years.
Conclusion
As revealed in the article, in order to create the income statement, entrepreneurs need to first learn the overview of the related components and understand how each component works. This enables them to correctly record each item into their statements.
Afterwards, entrepreneurs will be able to analyze their income statements by utilizing the two methods mentioned earlier: vertical and horizontal analysis. Essentially, both analytical methods provide insights with different aspects, allowing them to gain the notion of how to improve their business performance, drive its growth and achieve their entrepreneurial goals.

Copyright © 2025 Dezmon Landers